What is Data Analytics?
Data analytics is the process of collecting, cleaning, analyzing, and visualizing data to generate insights that support business decision-making. In the modern context, data analytics encompasses not only historical reporting (what happened), but also diagnostics (why it happened), predictive (what will happen), and prescriptive (what should be done).
PT Graha Teknologi Maju provides end-to-end data analytics services — from building data infrastructure to delivering dashboards that provide real-time insights to decision-makers in your organization.
Why is Data Analytics Important for Your Business?
In an era where data keeps growing, organizations that don't analyze their data will fall behind. Here are the concrete benefits of data analytics:
- Decisions based on facts, not assumptions. Dashboards displaying real-time metrics enable management to make decisions based on actual data, not intuition alone.
- Operational efficiency. By analyzing process data, you can identify bottlenecks, waste, and optimization opportunities invisible to the naked eye.
- Early problem detection. Automated alerts from analytics systems allow you to respond to anomalies before they become major problems — from sudden sales drops to machine failures.
- Predictions that support planning. Predictive analytics enables more accurate forecasting for inventory, budget, and resource planning.
Our Data Analytics Services
We provide various analytics services tailored to business needs:
- Business Intelligence Dashboards — Interactive data visualization platforms displaying KPIs and business metrics in real-time. Designed to be easily understood from C-level to operational managers. Our dashboards are interactive — users can drill-down, filter, and cross-reference between metrics.
- Automated Reporting — Automated reporting systems that generate and distribute periodic reports (daily, weekly, monthly) without manual intervention. Reports are delivered via email, Slack, or your preferred communication platform.
- Predictive Analytics — Machine learning-based prediction models for sales forecasting, demand planning, churn prediction, and predictive maintenance. We build models that not only predict but also explain the factors influencing predictions.
- Data Pipeline & ETL — Building data infrastructure that automates Extract, Transform, Load processes from various data sources to a centralized data warehouse. Our pipelines are designed for scalability and reliability.
- Data Quality Management — Assessment and improvement of organizational data quality, including deduplication, standardization, and automated validation. Poor quality data produces misleading insights — we ensure your data foundation is solid.
- Custom Analytics Solutions — Specialized analytics solutions tailored to your industry and unique organizational needs, including IoT analytics, geospatial analysis, and social media analytics.
Tools and Technology
We use a combination of technologies tailored to requirements:
- Custom Dashboards — Next.js and React for fully custom dashboards, providing complete flexibility in design and functionality. Ideal for organizations needing very specific UX.
- Open-Source BI Tools — Metabase for self-service analytics, Grafana for infrastructure and IoT monitoring. Rapid deployment with zero licensing costs.
- Data Processing — Python (Pandas, NumPy, Scikit-learn) for data analysis and model development. SQL for data queries and transformations.
- Data Infrastructure — PostgreSQL as a data warehouse, with partitioning and indexing capabilities for fast queries on large datasets.
- Visualization — D3.js and Recharts for custom interactive and responsive data visualizations.
Expected Results
Our data analytics projects have delivered measurable impact for clients:
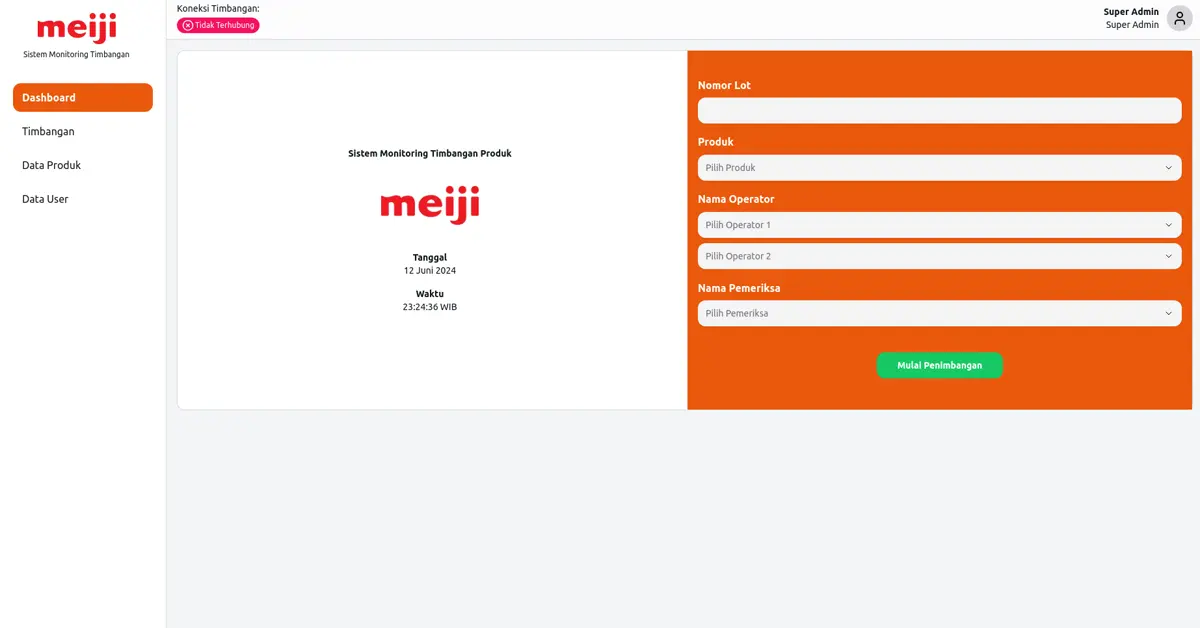
- Meiji Weighing Monitoring Dashboard: A real-time production monitoring system for Meiji's factory in Indonesia. The dashboard displays weighing data, production trends, and automated alerts for deviations, helping the production team identify and respond to issues within minutes, not hours.
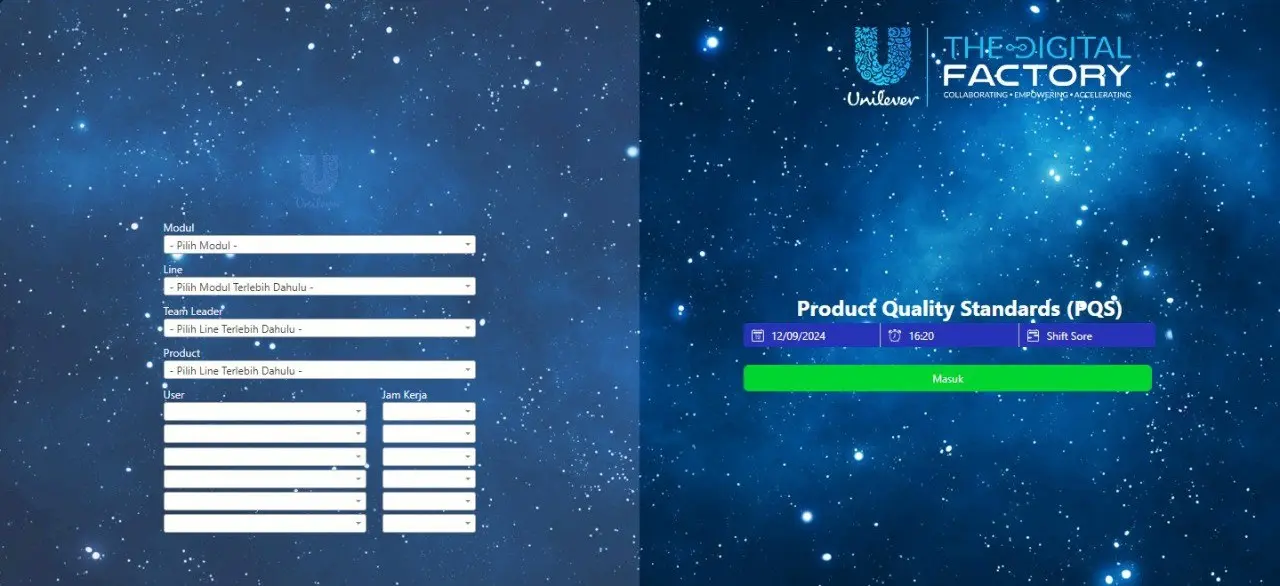
- Unilever PQS (Product Quality System): A quality data analytics platform for Unilever's production line. The system automatically analyzes product quality data, identifies defect trends, and provides insights for continuous improvement.
Measurable Benefits of Data Analytics
Based on our project experience, clients typically experience:
- 70-90% reduction in reporting time — reports that previously took hours are now available automatically in seconds
- Improved decision accuracy — data-driven decisions reduce the risk of wrong calls
- Operational cost savings — identification of previously hidden waste and inefficiency
- Faster problem response — automated alerts shorten anomaly detection time from days to minutes
Types of Data We Can Analyze
We have experience analyzing various types of business data:
- Transactional Data — Sales, purchases, inventory movements, and financial data
- Operational Data — Production logs, machine sensor data, uptime/downtime, and throughput
- Customer Data — Customer profiles, interaction history, feedback, and behavioral data
- IoT/Sensor Data — Real-time data from industrial sensors, GPS trackers, and IoT devices
- External Data — Market data, weather, social media, and other public data sources
We help connect all these data sources into a unified platform that provides a 360-degree view of your business. No matter how diverse your data sources are — we have the experience to integrate them into one cohesive dashboard that is easily understood by all management levels.
Ready to Turn Data into Better Decisions?
Contact us to discuss how data analytics can give your organization a competitive advantage.